Cloudflare RUM Update:Find the Slow Phase Before Upgrading Hosting
Cloudflare's 13 October RUM update adds LCP and INP sub-parts. Find the slow phase, handle API units correctly, and choose a fix using evidence.

On this page
- What changed on 13 October?
- Who can use it, and what access is needed?
- Read the two breakdowns correctly
- A practical triage: what should you inspect next?
- API users: units and unavailable values matter
- The percentile trap: do not add P75 sub-parts
- What if the report is empty or incomplete?
- Decide whether a change worked
- Reader questions
- Sources & further reading
The short answer
Cloudflare added LCP/INP sub-part reports and separate connection/TLS timings on 13 October 2026. Investigate the slow phase before changing hosting or frontend settings.
Before you start
Read access to the site's Cloudflare Web Analytics reports and an active RUM beacon. Use a modern browser with developer tools for local reproduction. Back up the site and prepare rollback before making performance changes.
A slow website does not automatically need a bigger server. The delay may sit before the HTML arrives, while the browser discovers an image, or after the page is loaded when a visitor taps a button.
Cloudflare's 13 October 2026 Web Analytics update makes those questions easier to investigate. This guide explains what is new and proposes a small, evidence-first workflow for website owners and developers. It is not a benchmark of Hostlelo or Cloudflare.
What changed on 13 October?
Cloudflare announced LCP and INP sub-part reporting in Real User Monitoring (RUM), alongside separate connection and TLS timings. The reports are available through the dashboard and GraphQL Analytics API. The existing combined connection metric remains.
This is a new reporting capability, not a new definition of Core Web Vitals, a security patch or an outage announcement. The dated release note is the event evidence; this article was researched on 14 October 2026.
The practical opportunity is to ask where time is spent before choosing a fix. A sub-part indicates a place to investigate, not a diagnosis by itself.
Who can use it, and what access is needed?
This is relevant to people running WordPress, storefronts, SaaS pages or other sites with Cloudflare Web Analytics collecting browser measurements. It does not require a particular WordPress or PHP release: this is an analytics feature rather than a CMS update.
Cloudflare's overview lists Web Analytics as available on all plans. Its limits page currently permits 10 non-proxied sites and no site-count limit for proxied sites; configuration-rule limits differ by plan. These are service limits, not a promise that every visit produces every metric.
For a site not proxied through Cloudflare, follow the official setup instructions: add its hostname in Web Analytics, obtain its own snippet from Manage site, and insert it before the closing body tag. Proxied sites have an automatic-setup path. Check the actual site's configuration rather than assuming that using Cloudflare DNS means RUM is active.
Start with dashboard read access. Before editing templates, scripts or cache rules, have a tested rollback and a recoverable website backup. No server, DNS or TLS changes are needed just to inspect the report.
Read the two breakdowns correctly
LCP concerns the main visible content; INP concerns responsiveness to qualifying interactions. Cloudflare's Core Web Vitals documentation describes these stages:
- LCP: time to first byte. How long did the browser wait for the document?
- LCP: resource load delay. Was the important resource discovered late?
- LCP: resource load duration. Did downloading that resource take time?
- LCP: element render delay. Why was the element not visible after its resource arrived?
- INP: input delay. Was processing the interaction initially blocked?
- INP: processing duration. Did the event handlers run for too long?
- INP: presentation delay. Did displaying the next frame take too long?
Open Web Analytics, select the site, then Core Web Vitals and scroll to the sub-parts. Use Page Load for the connection/TLS split. Filter the vitals by the relevant URL, browser, operating system, country or element where available, rather than treating a whole-site number as the experience of every visitor.
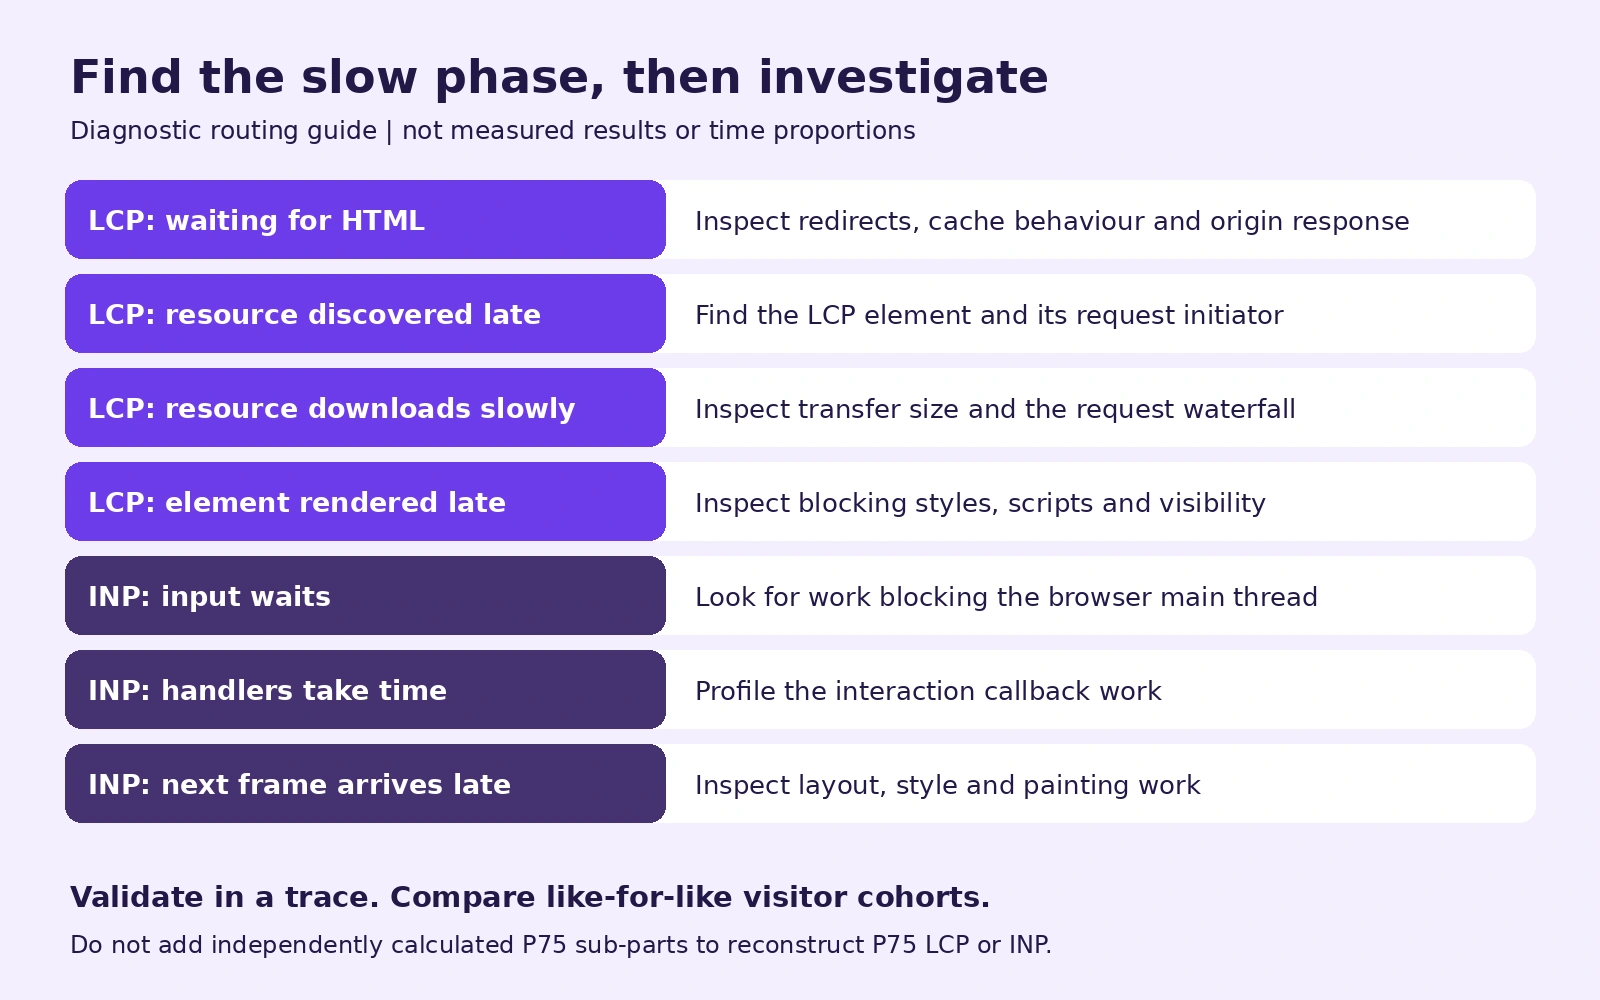
This original routing guide shows investigation directions, not measured durations or guaranteed fixes.
A practical triage: what should you inspect next?
The following is our proposed workflow, not a vendor claim of automatic root-cause detection.
1. Write down the complaint before opening settings
Record the affected page, visitor action, approximate time and environment. “The product image appears late on mobile” is a different problem from “the add-to-cart button feels stuck.” Keep the URL path and the report's date range with your notes.
Choose one representative page first. Do not change five optimisation plugins at once; that makes both regressions and improvements harder to attribute.
2. For slow LCP, inspect a matching browser trace
Google's LCP optimisation guide explains why optimising one stage may merely shift time into another. A smaller image, for example, will not remove a script that keeps the element hidden.
Use the field report to guide a DevTools recording under a relevant environment:
- High TTFB: examine redirects, cache behaviour, network distance and origin response. TTFB is not a pure CPU measurement.
- High resource load delay: locate the actual LCP element and its request initiator. Check whether a hero image is only discovered through JavaScript or late CSS; avoid lazy-loading the image that is actually the LCP.
- High resource load duration: inspect the selected image size, responsive variants and waterfall.
- High render delay: look for blocking CSS, scripts, fonts or visibility logic that prevent display.
For a WordPress site, use our LiteSpeed Cache setup guide only when the evidence points toward an applicable cache or asset issue. Cache settings are not a universal remedy for every stage.
3. For slow INP, reproduce the specific interaction
Google's INP optimisation guidance recommends starting with field evidence and then reproducing the slow interaction in the lab.
Inspect main-thread work before the handler for input delay, callback work for processing duration, and layout/style/paint work for presentation delay. A long task, excessive event-handler work or expensive layout can be more relevant than server memory.
Record the real flow: open the menu, apply a filter or submit a form. A page-load-only test does not reproduce those actions. When proposing a change, preserve validation, accessibility and the business behaviour of the control.
4. Treat connection and TLS timings as clues
The new split can justify a closer look at a visitor cohort's connection establishment. It does not prove that the site's certificate is broken or that Cloudflare is having a global incident.
Our suggested next check is to reproduce the request from the affected environment and inspect the network timing alongside redirects and connection reuse. Keep browser-side timings separate from origin logs: they describe different parts of the journey. Do not disable HTTPS or weaken TLS settings as a speed experiment.
API users: units and unavailable values matter
The release documents LCP/INP sub-part percentiles on rumWebVitalsEventsAdaptiveGroups, and connection/TLS percentiles on rumPerformanceEventsAdaptiveGroups. For example, lcpResourceLoadDelayP50 and inpInputDelayP50 are sub-part fields.
These API values are microseconds. Divide by 1,000 for milliseconds. Negative values mean unavailable, not an unusually fast result. Consult the GraphQL Analytics documentation for authenticated querying rather than copying a query with an invented account identifier.
Here is an illustrative JavaScript formatter. The input values are invented; this is not a Cloudflare response or an executed performance experiment.
const exampleSubpartsUs = {
  lcpResourceLoadDelayP50: 120000,
  inpInputDelayP50: -1,
};

function microsecondsToMilliseconds(value) {
  return typeof value === "number" &&
    Number.isFinite(value) &&
    value >= 0
      ? value / 1000
      : null;
}

for (const [field, value] of Object.entries(exampleSubpartsUs)) {
  const ms = microsecondsToMilliseconds(value);
  console.log(field, ms === null ? "unavailable" : ms + " ms");
}
Expected arithmetic: 120000 becomes 120 ms; -1 becomes unavailable. Missing, non-numeric and non-finite inputs also remain unavailable instead of becoming zero. This formatter deliberately does not generate a total score.
The percentile trap: do not add P75 sub-parts
For one matching navigation or interaction trace, its component durations can describe its total timing. Independently calculated percentiles across many records are different. The visit at the 75th percentile for one component need not be the visit at the 75th percentile for another.
A small mathematical example, not website data: two observations have components (0, 100) and (100, 0). Each observation totals 100. Using the nearest-rank 75th percentile, each component's P75 is 100; their sum is 200, while the total's P75 is 100.
Therefore, use the reported total LCP or INP to assess the overall metric, and component distributions to guide investigation. Do not fabricate a “total P75” by adding component P75 fields. The same warning applies to other independently aggregated percentiles.
What if the report is empty or incomplete?
Missing data is not evidence that your site is fast.
Cloudflare's FAQ notes that blockers can prevent beacon collection, network conditions can lose reports, and a public, no-transform cache-control header prevents automatic snippet injection. Verify installation and collection before interpreting a blank report. Do not silently remove privacy or content-security controls to collect more data.
Google's INP documentation also explains that a visit with no click, tap or keypress may produce no INP. Scrolling and hovering alone do not supply a qualifying interaction. Browser API support and the observed visitor population can affect which measurements are available.
If a cohort has little data, label the conclusion tentative. A local trace can help find a bug but is not a replacement for enough real-user observations.
Decide whether a change worked
Our suggested acceptance note has five fields: affected URL, cohort and date range, suspected stage, single change, and before/after evidence. Include a rollback condition such as a broken checkout or navigation regression.
Compare comparable periods and visitor groups, while noting traffic-mix changes. Recheck the total metric and the affected function, not only the stage you targeted. There is no universal waiting period or sample count that makes every site's conclusion reliable.
Only consider a hosting upgrade after the investigation points toward an origin constraint and supporting evidence such as resource saturation or slow uncached responses. Otherwise, you may pay for capacity without addressing the delay visitors actually experience.
The useful outcome of this release is not another score to chase. It is a better starting question: which phase should we investigate first?
Reader questions
Does this Cloudflare update make my website faster automatically?
No. It adds diagnostics. Improvements require identifying and changing the relevant cause, then checking the outcome.
Do I need a WordPress or PHP update to use these reports?
No specific WordPress or PHP version is required by this analytics announcement. Your site needs Cloudflare Web Analytics collecting browser data.
Can I add the P75 sub-parts to get P75 LCP or INP?
No. Independently calculated percentiles can correspond to different observations. Use the reported overall metric rather than a sum of component percentiles.
Why might a visit have no INP measurement?
A visit without a qualifying click, tap or keypress can have no INP. Scrolling or hovering alone does not provide one. Missing data is not a passing result.
Does high TTFB mean I need bigger hosting?
Not necessarily. Investigate redirects, caching, network conditions and origin response, then corroborate any suspected origin constraint before upgrading.
Sources & further reading
- Cloudflare release announcement, 13 October 2026
- Cloudflare Core Web Vitals documentation, updated 13 October 2026
- Cloudflare Web Analytics overview
- Cloudflare Web Analytics setup
- Cloudflare Web Analytics limits, updated 12 August 2026
- Cloudflare Web Analytics FAQ
- Cloudflare GraphQL Analytics API documentation
- Google web.dev: Optimise LCP, updated 31 March 2025
- Google web.dev: Optimise INP, updated 2 September 2025
- Google web.dev: INP and absent measurements
Originally published . About our editorial updates.